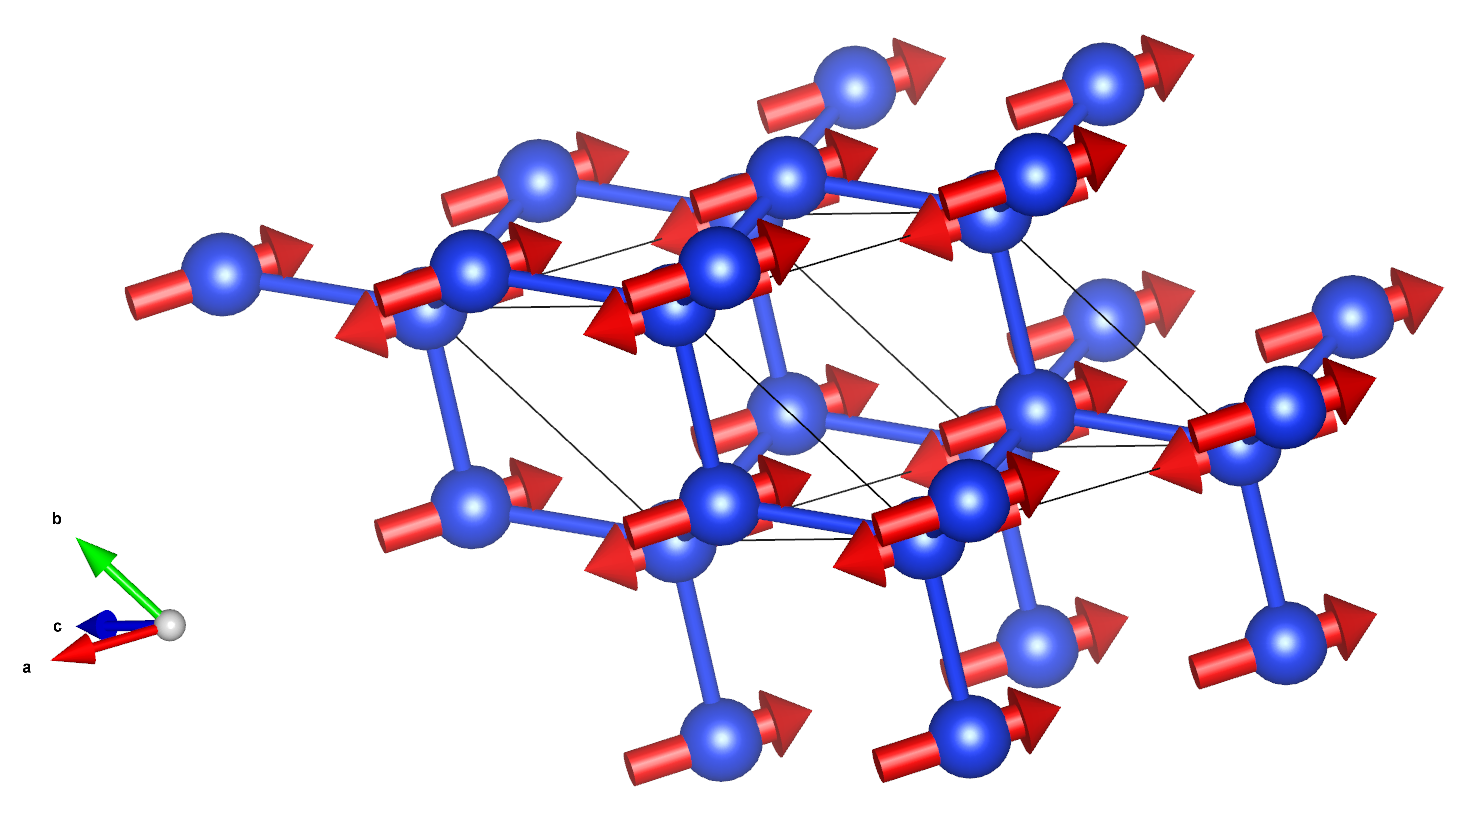
vibration plot mode in vesta-2
vibration-plot-mode-in-vesta-2
Abstract
This is an updated version of vibration-plot-mode-in-vesta code. The main function is the same as older version, which is to automatically convert the vibration modes at Γ point calculated by other software to Vesta format file to visualize it. The improvements include:
- Simplify operating procedures and make it more automated: No more manual generation of initial Vesta files.
- More complete information: Beside the vibration modes in vesta file, other information such as vibration frequency, atoms cartesian coordinate etc is also exported to a csv file.
- Supports converting results from more calculation software: Not only the results of vasp calculation, the calculation results of phonopy are also supported.
Usage
1. Generate VESTA mode files from VASP calculation
a. Perform phonons calculation in vasp
There are two methods to calculate phonons at Γ point in vasp. The first is finite differences.For finite differences calculation, IBRION should be set 5 or 6, NSW=1, and ISIF, POTIM, NFREE should be set carefully.
The second method is density-functional-perturbation theory, For density-functional-perturbation theory calculation, IBRION should be set 7 or 8, NSW=1.
After this step, you can get the OUTCAR from the calculation. Also, the input file POSCAR is needed for next step.
b. Run python script
With POSCAR file and OUTCAR file from previous step, now run command
1 | python vasp_modes_to_vesta.py |
and you can get the result.
The dependent libraries for running the python script are:
The parameters that need to be set in the python script are:
1 | dir_out_file = 'out' # The directory for saving result file |
2. Generate VESTA mode files from Phonopy calculation
a. Perform force sets calculation in phonopy
Since phonopy itself cannot perform DFT calculation, this step requires the use of DFT software. vasp, quantum-espresso, abinit, etc. are all ok. Here is the referencce:
- vasp: https://phonopy.github.io/phonopy/vasp.html#vasp-interface
- qe: https://phonopy.github.io/phonopy/qe.html
- cp2k: https://phonopy.github.io/phonopy/cp2k.html
- …
Before calculating force sets, the input parameters of supercell_matrix and initial unitcell are also needed for next step, together with the force sets file generated in this step.
b. Run python script
With unitcell file , force sets file and supercell_matrix from previous step, now run command
1 | python phonopy_modes_to_vesta.py |
and you can get the result.
The dependent libraries for running the python script are:
The parameters that need to be set in the python script are:
1 | dir_out_file = 'out' # The directory for saving result file |
Tips
1. How to read phonons calculation results from OUTCAR file
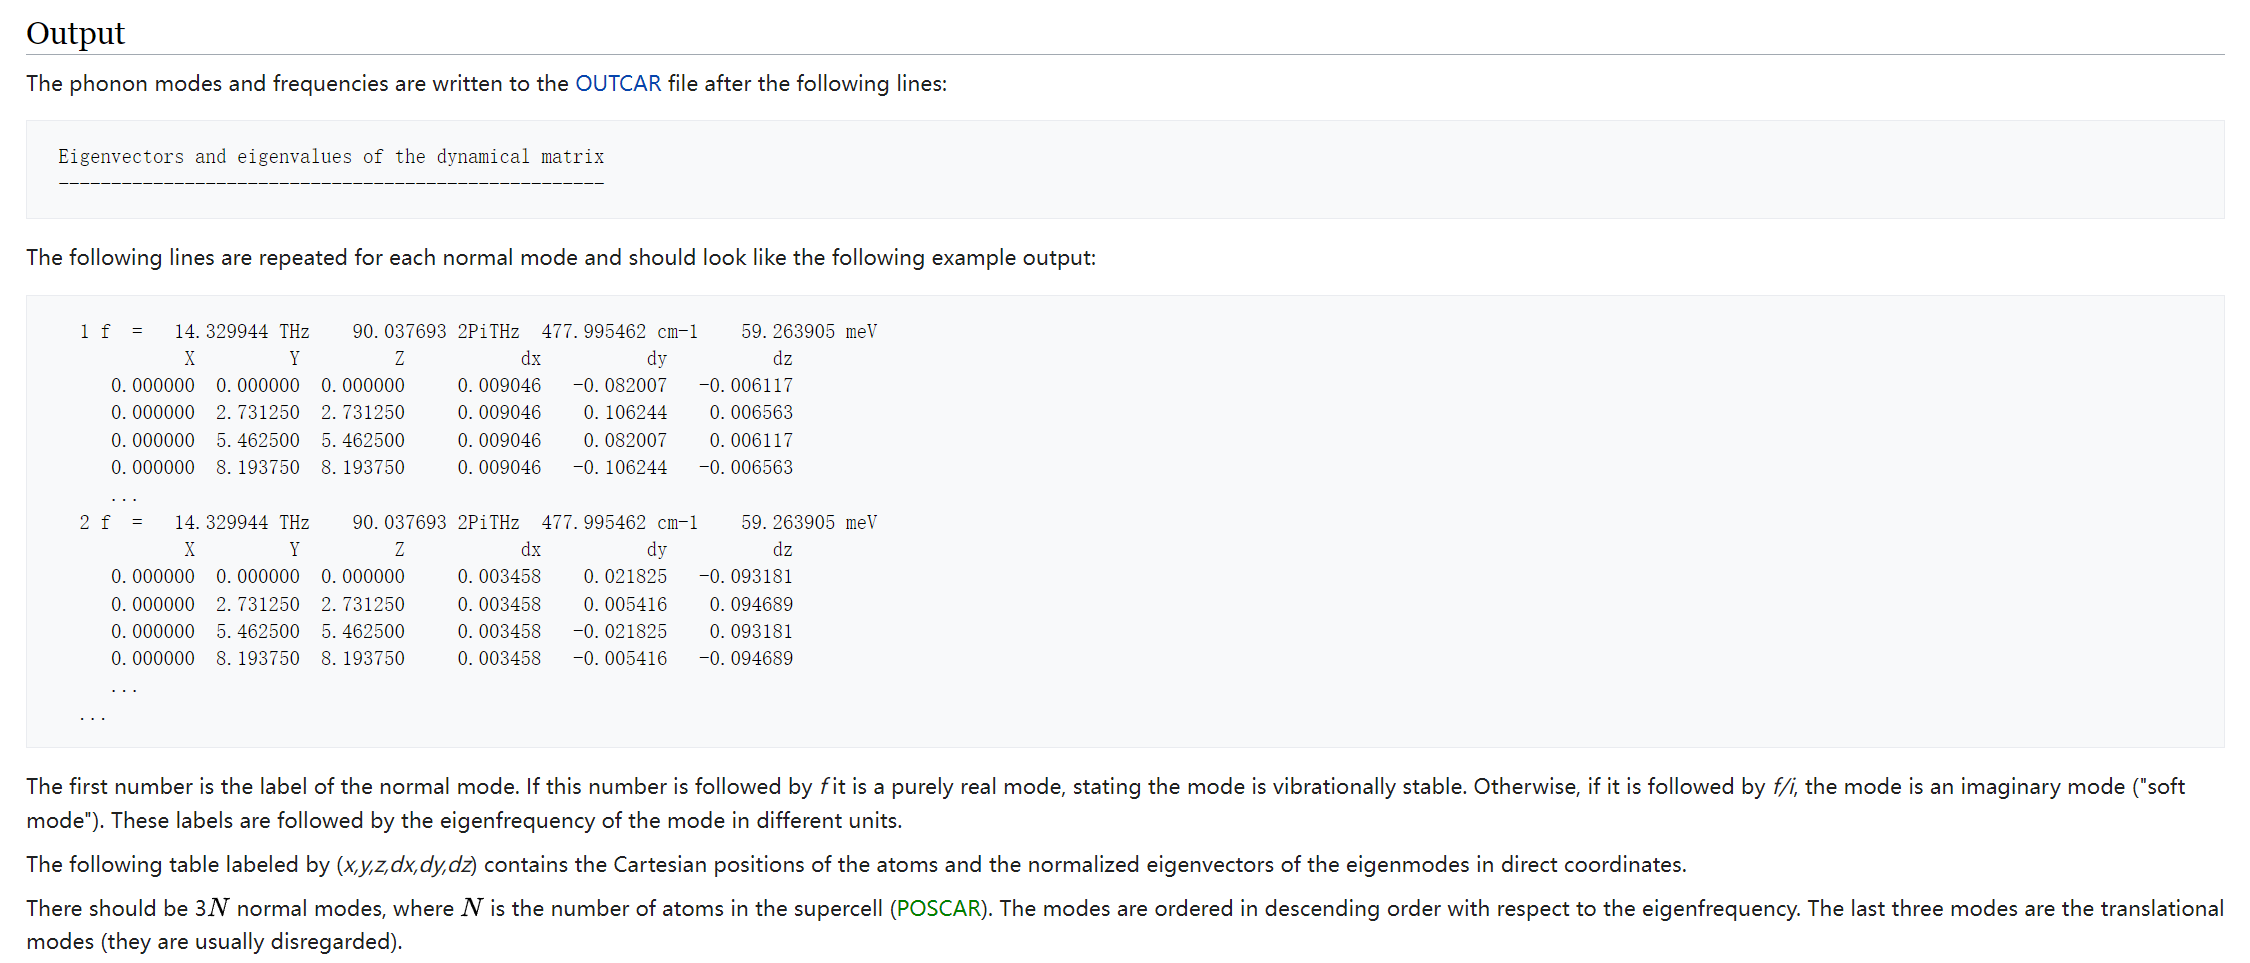
https://www.vasp.at/wiki/index.php/Phonons_from_finite_differences
2. How to read eigenvectors from phonopy calculation
General#
Key |
Description |
|---|---|
nqpoint |
Number of q-points calculated. |
natom |
Number of atoms in the primitive cell. |
phonon |
Key name of list for q-points. |
q-position |
Position of q-vector in reduced coordinates. |
band |
Key name of list for bands. |
frequency |
Phonon frequency in a specified unit at each phonon mode |
eigenvector |
Eigenvector at each phonon mode.
Each eigenvector :math: |
group_velocity |
Group velocity at each phonon mode in the Cartesian coordinates defined in the unit cell. |
The form of eigenvector output by phonopy
| Band #1 | Band #2 | … | Band #3N | |
|---|---|---|---|---|
| Atom #1 | Eig_X | Eig_X | … | Eig_X |
| Atom #1 | Eig_Y | Eig_Y | … | Eig_Y |
| Atom #1 | Eig_Z | Eig_Z | … | Eig_Z |
| … | … | … | … | … |
| Atom #N | Eig_X | Eig_X | … | Eig_X |
| Atom #N | Eig_Y | Eig_Y | … | Eig_Y |
| Atom #N | Eig_Z | Eig_Z | … | Eig_Z |
References
Refers to the examples of Si for more details.
Some related repositories in Github: